With a deceptively simple question: could a model find the borders between panels on a comic or manga page?
The idea was to make comics more mobile-friendly. A full page shrunk to fit a phone screen can be difficult to read, but reliable panel borders could let a reader move through smaller, panel-sized views instead.
That meant finding panels without assuming that every one was rectangular or separated by a perfectly straight white gutter. Manga pages are rarely that cooperative. Panels can be stacked, inset, diagonal, borderless, or interrupted by artwork.
I treated the problem as image segmentation. Instead of asking a model how many panels were on a page, I trained it to produce a mask in which panel boundaries were bright and everything else was dark. Ordinary image-processing tools could then use those predicted lines to form regions and crops.
I built the hand-labelled dataset, tried several U-Net configurations, and eventually trained what became model 19.
The Canny and Hough experiment
Before relying on a neural-network mask, I tried turning each page into a geometry puzzle:
- Canny reduced the page to likely edges.
- A Hough transform searched those edges for nearly horizontal and vertical line segments.
- The notebook scattered blue seed points across the page.
- For each point, it looked for the closest line above, below, left, and right. Those four lines became a proposed panel box.
Figure 1
Panel proposals from Canny edges and Hough lines
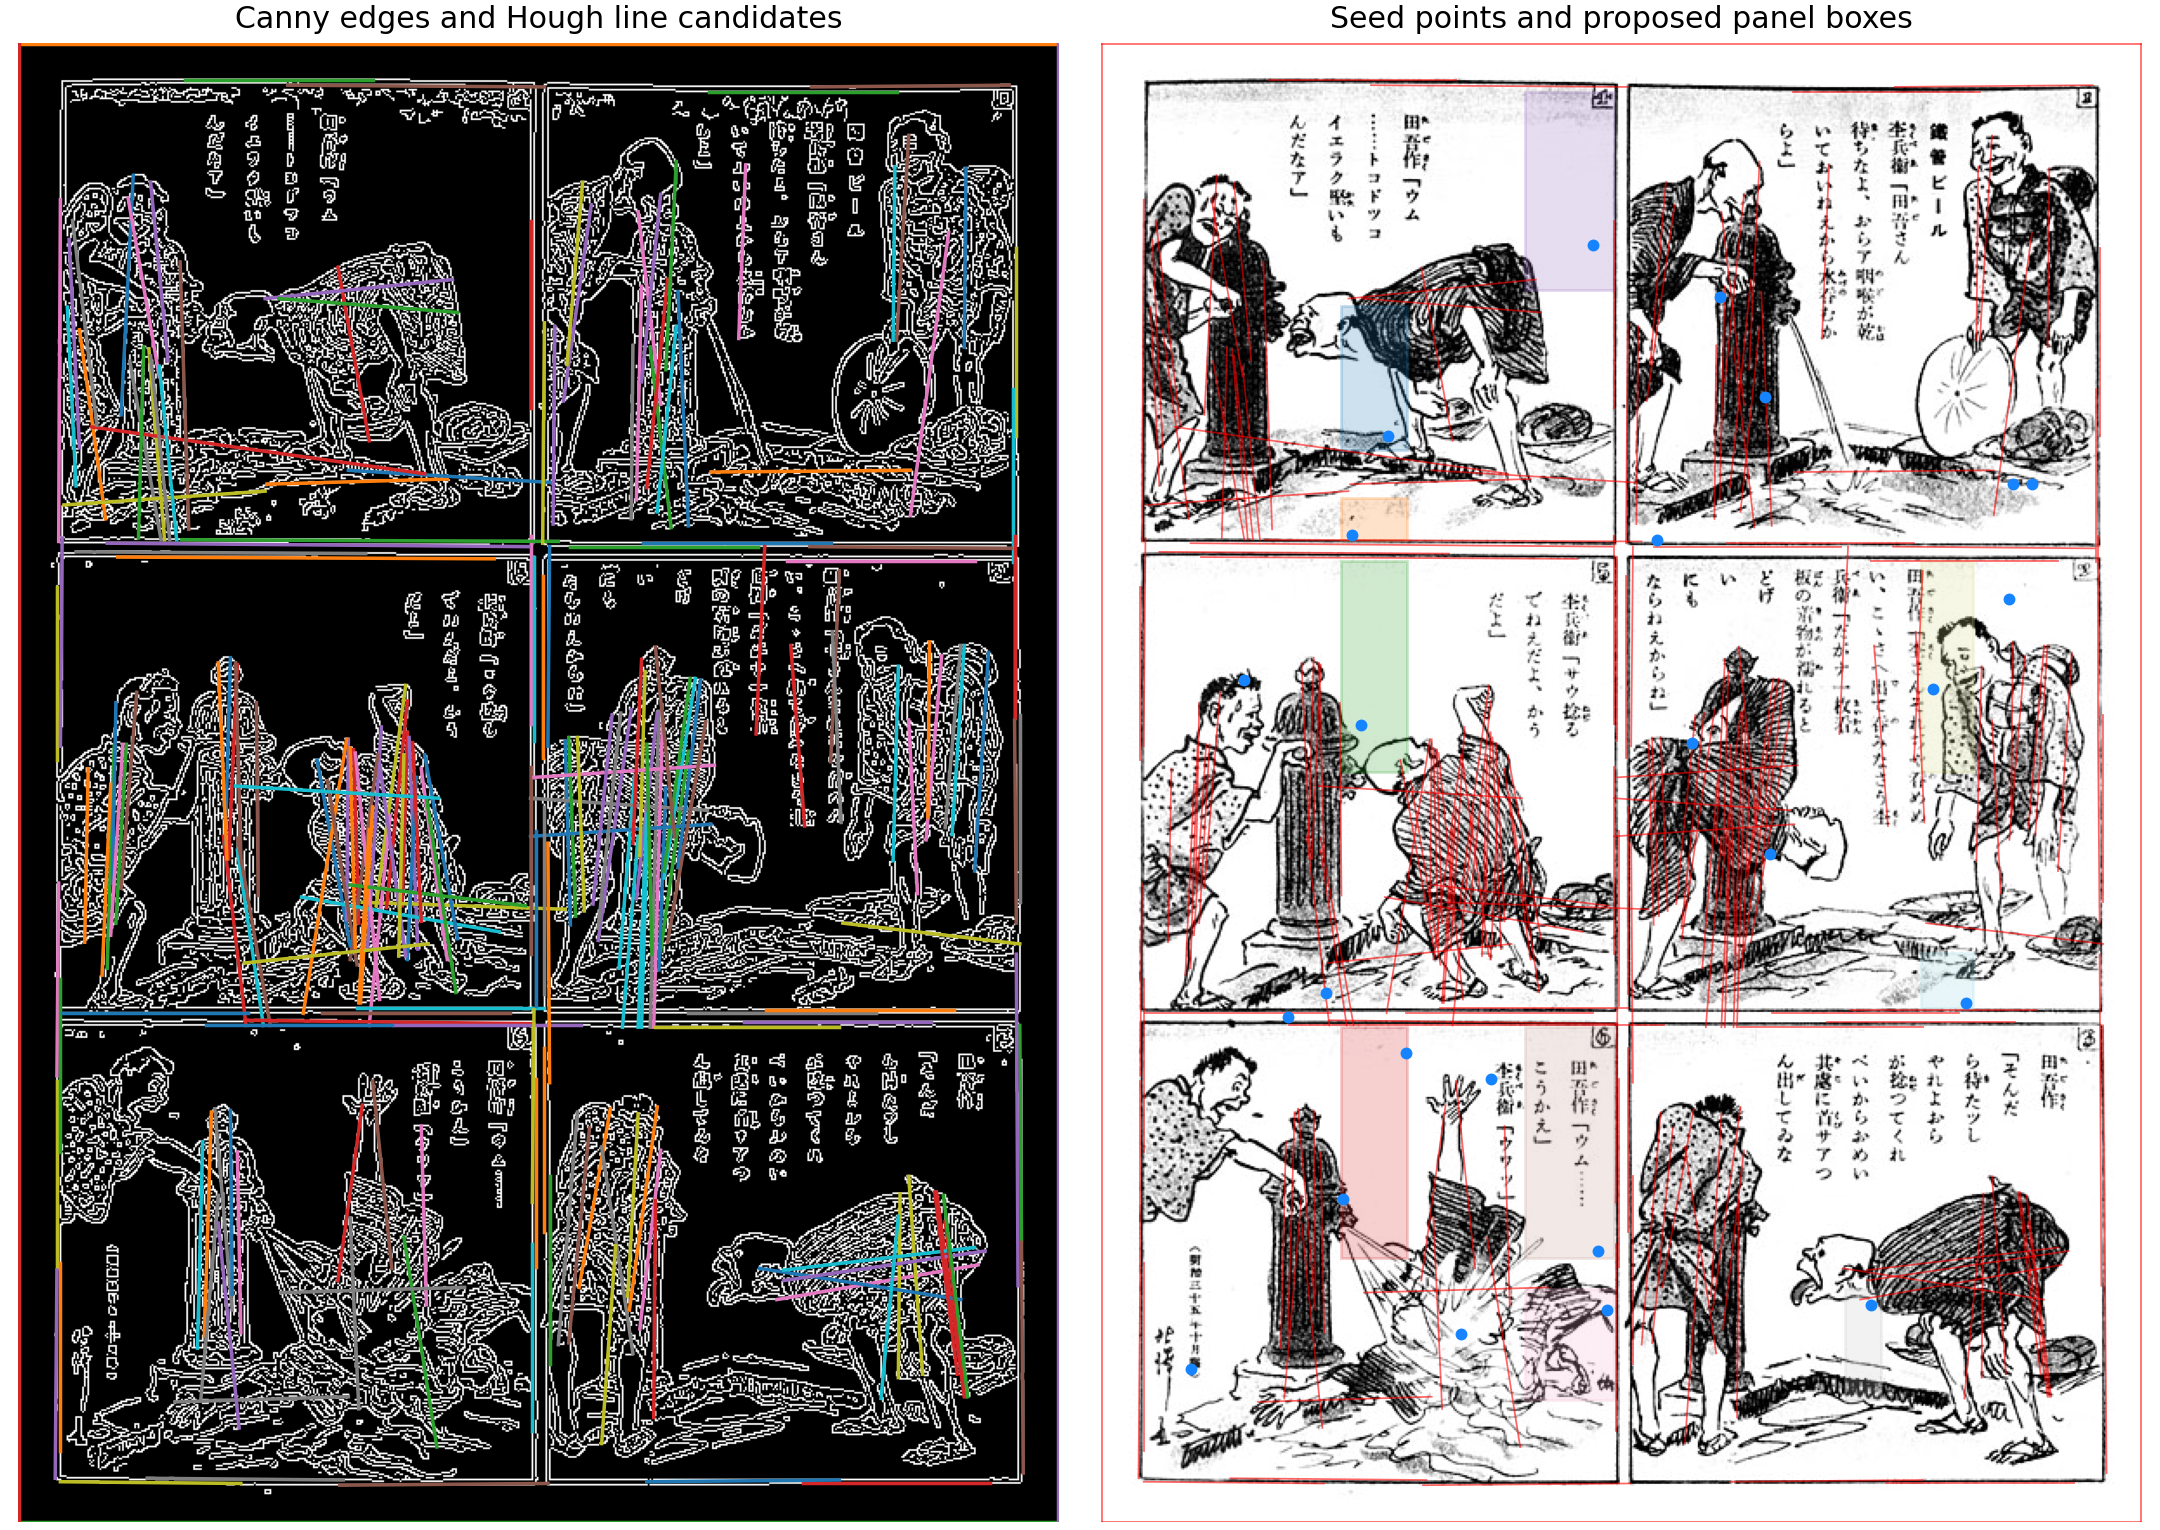
A recreation of the early experiment on the public-domain Tagosaku page. Coloured lines show Hough candidates; red lines, blue points, and translucent boxes show how the panel proposals were assembled.
Note: The method produced missing, thin, duplicate, and overlapping proposals and did not become a dependable page splitter.
The picture also makes the problem easy to see. Illustrated pages contain many straight-looking edges that are not panel borders. Some seed points could not find four useful boundaries, while others produced thin, duplicate, or overlapping boxes. The method never became a dependable page splitter.
Making the training set by hand
The most important part of the project was not the neural network. It was creating a useful target for it.
I drew the panel outlines with VGG Image Annotator (VIA), a free and open-source tool from Oxford’s Visual Geometry Group. It is a lightweight web app that can run offline in a browser without installation, and its permissive BSD two-clause license allows academic and commercial use. That license covers the annotation tool, not the copyright of images being labelled.
VIA exported the rectangles, polygons, and polylines as CSV and JSON. The preprocessing code read the CSV coordinates and drew them as five-pixel-wide boundary masks to pair with the original pages.
The preprocessing run contains 263 VIA page references. That is a small dataset for image segmentation, so I generated variations of each usable page. The pipeline kept the original and created 15 augmented versions using horizontal flips, blur, contrast, noise, brightness changes, scaling, shear, and rotation.
The result was exactly 4,208 paired images and masks:
263 pages × (1 original + 15 augmentations) = 4,208 samples
Combining old-school vision with a U-Net
The final input was not just the original artwork. Each page was resized to 512 × 512 pixels and represented by three channels:
- The grayscale page.
- A Canny edge map with sigma 0.5.
- A Canny edge map with sigma 2.15.
A Canny edge detector turns an image into thin lines where brightness changes sharply. It first smooths noise, then keeps the strongest connected changes. The lower sigma preserved more fine ink and detail; the higher sigma smoothed more detail away to emphasize broader structure.
This was a deliberately hybrid approach. Canny supplied two hand-engineered views of the ink, while the neural network learned which edges were likely to belong to panel structure.
The network was a compact U-Net. Its encoder used 16, 32, and 64 filters to compress the page and learn broader layout cues. The decoder expanded those features back to the original resolution and reused earlier activations through skip connections, which were intended to preserve thin boundary detail.
Model 19 used 7 × 7 ELU convolutions, 2 × 2 pooling, batch normalization, dropout, and a sigmoid output. It contained 591,281 parameters. Training used a soft Dice loss and a custom soft intersection-over-union metric calculated directly from the predicted probabilities.
Trying one idea at a time
I used the notebooks to change one part of the pipeline at a time and record what happened. I tried different image sizes, boundary thicknesses, crops, channel combinations, and convolution kernels.
Some representative notebook-recorded results were:
Table 1
Selected archived configurations and notebook-recorded soft validation IoU
| Input | Experiment | Soft validation IoU |
|---|---|---|
| 256 × 256 × 1 | Grayscale with 10-pixel targets | 0.7341 |
| 640 × 640 source crops | Crops resized to 256 × 256 model input | 0.7313 |
| 256 × 256 × 3 | Grayscale and two Canny channels | 0.7012 |
| 512 × 512 × 3 | Model 19 with 7 × 7 kernels | 0.7530 |
Note: These numbers are an experiment diary, not a controlled leaderboard. The dataset and preprocessing changed between runs, so the scores should not be treated as direct comparisons. Soft validation IoU measures how much the predicted and hand-drawn boundary masks overlap; a value closer to 1 means more overlap.
Some old filenames called the three-channel models “3D.” They still used ordinary 2D convolutions; the third dimension was simply the grayscale image plus two Canny maps.
Results and limitations
We recorded a 45-epoch training continuation. Soft validation IoU reached its best saved value, 0.75295, at epoch 35. Training stopped after epoch 45 and restored the epoch-35 weights.
Figure 2
Model 19 training and validation soft IoU
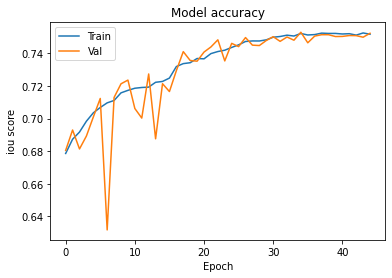
Validation soft IoU reached the best saved value of 0.75295 at epoch 35; training stopped after epoch 45 and restored those weights.
Note: Augmented versions of the same page may occur on both sides of the generated train-validation split, and no independent test set is preserved.
The train-validation split was made from generated filenames rather than grouped by original page or chapter. Augmented versions of the same page may therefore have appeared on both sides of the split. There is also no preserved independent test set.
For that reason, I would not describe 0.753 as benchmark accuracy. It is the best custom soft validation IoU recorded by this project’s generated split.
I used Rakuten Kitazawa’s public-domain 1902 comic Tagosaku to Mokube no Tokyo Kenbutsu. It is not part of the training data and has a regular six-panel layout. A whole-page prediction resized the 600 × 853 page to the model’s 512 × 512 input and marked 2.036% of pixels as boundaries at a 0.5 threshold.
Figure 3
Model 19 tiled prediction on an unseen comic page
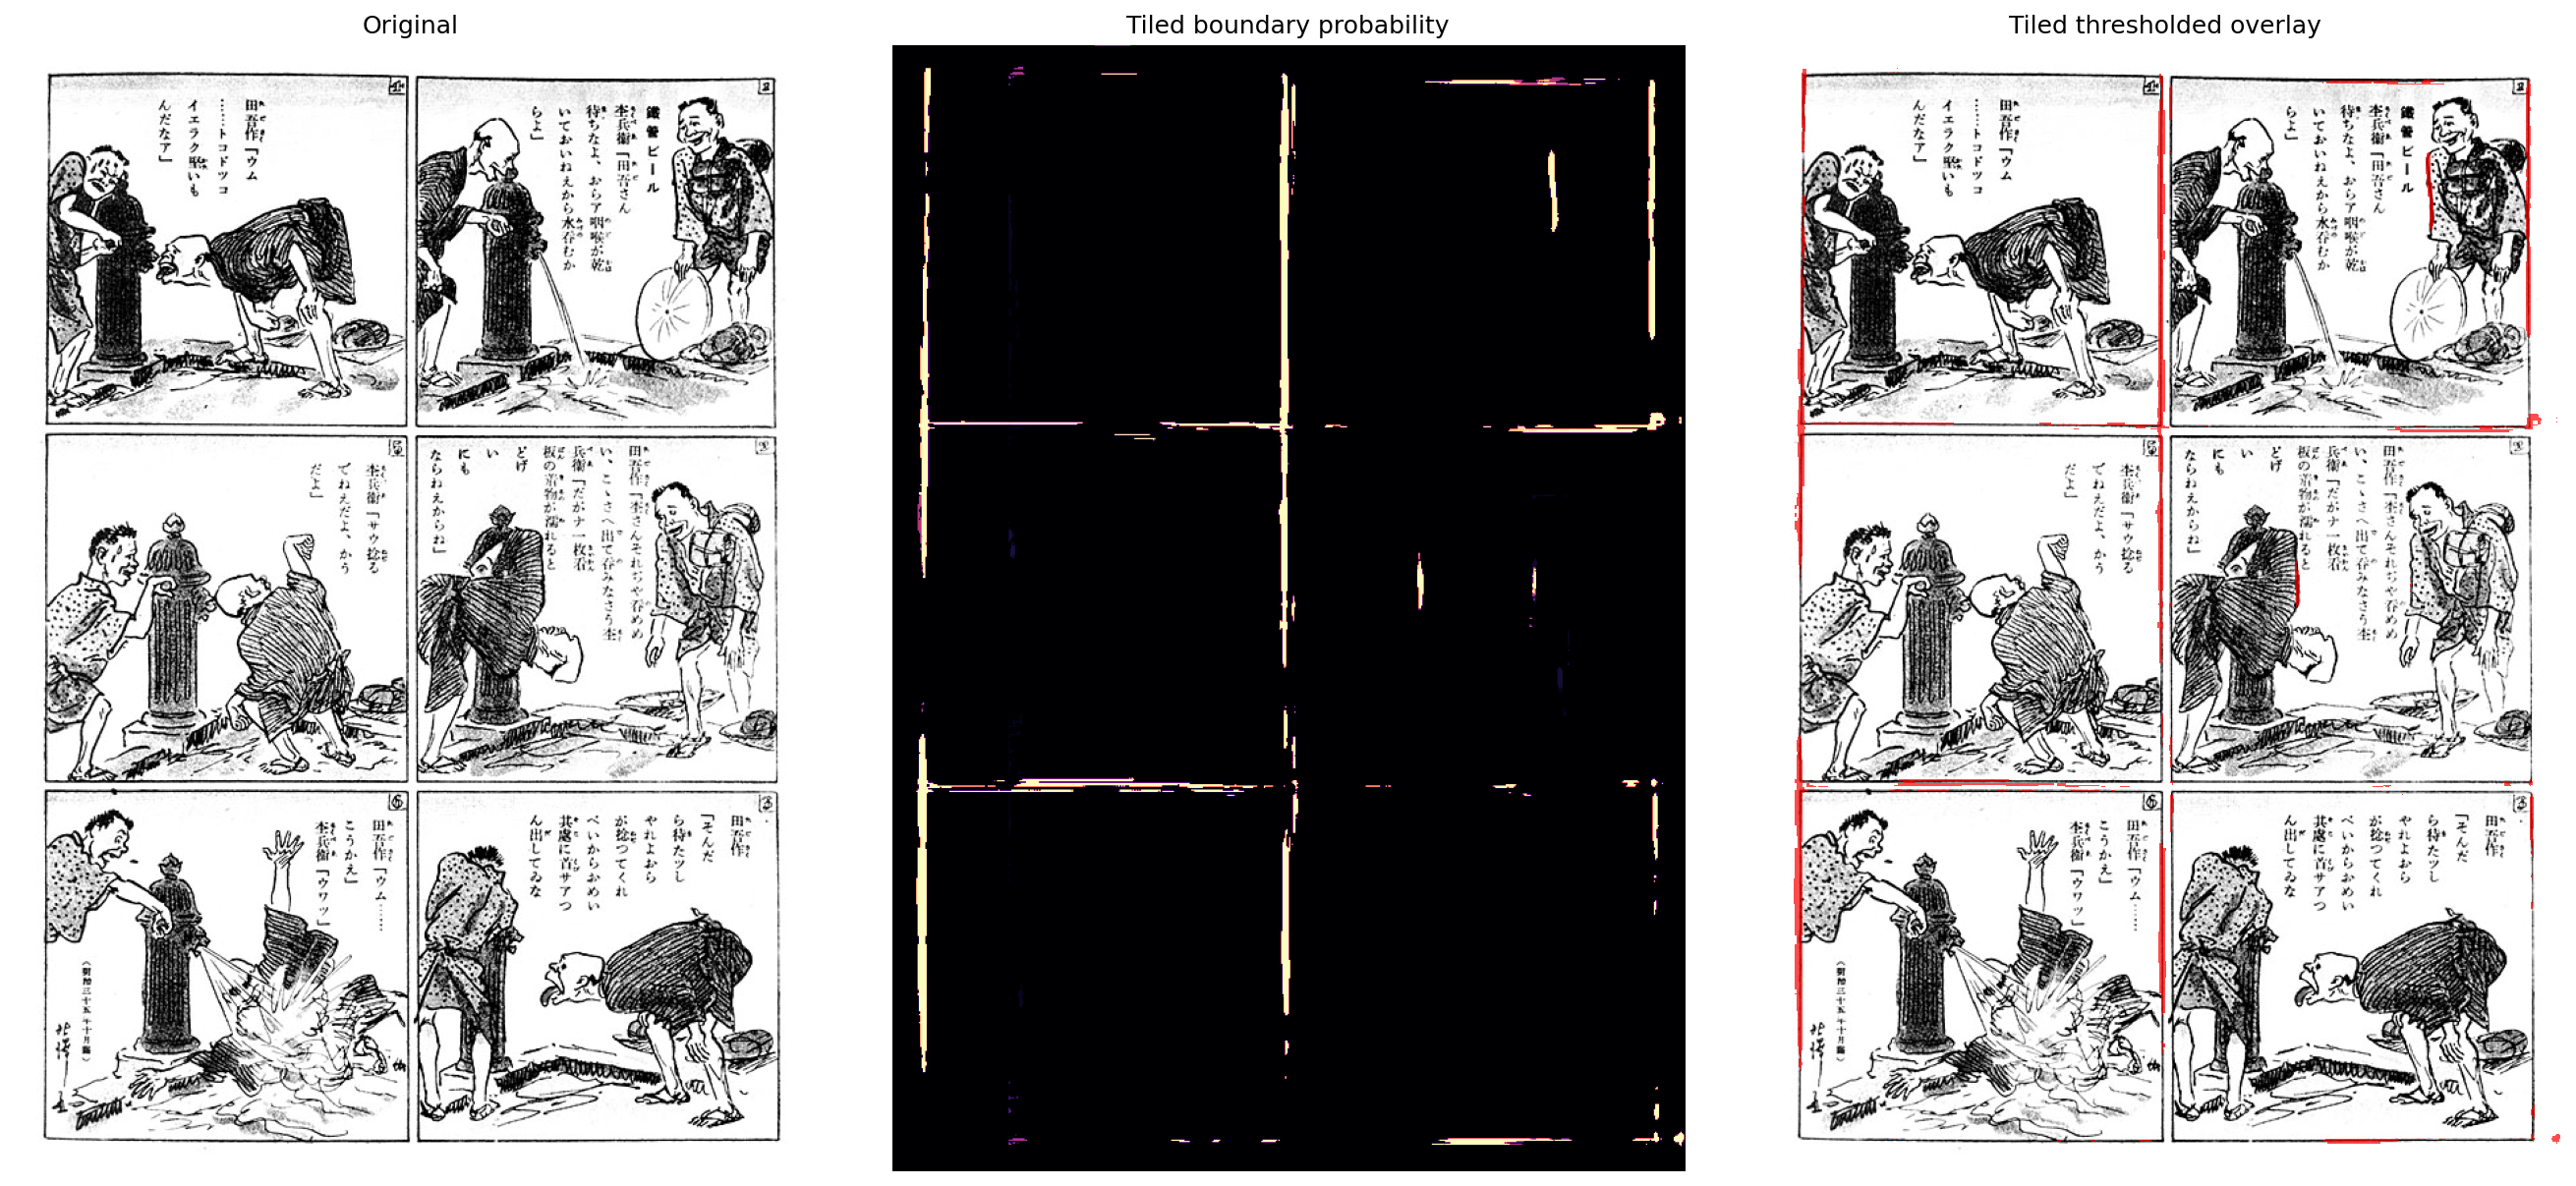
A fresh tiled prediction on Rakuten Kitazawa's 1902 Tagosaku to Mokube no Tokyo Kenbutsu. The source page is public domain. Model 19 detects all six rectangular panels, with small gaps and some response at the outer page edge.
Note: This public-domain page was not part of the training data.
This is not polished research, and that is part of why I still enjoy the project. It captures the entire learning loop: invent a useful target, make the labels by hand, try several ideas, keep the failures, and eventually get a model to draw something recognizably useful.