Abstract
This page describes weekly stock-price observations around 780 Swedish ex-dividend events. Each event is one stock on one ex-dividend date. The analysis compares mean price changes across three dividend-yield groups, using the weekly observation before the ex-dividend date as its baseline.
1. Introduction
On the ex-dividend date, a stock begins trading without the right to the next dividend payment. This analysis examines how the selected stocks’ recorded weekly prices move before and after that date and whether the descriptive pattern differs by dividend yield.
Research Questions
- How do weekly price changes compare across yield groups?
- What patterns appear in the weekly observations after the ex-dividend date?
- What patterns appear in the weekly observations before the dividend?
2. Methodology
The source pipeline matches ordinary Avanza dividend records with exact-date stock-price observations. It retains 780 of 4,302 ordinary dividend records reviewed, or 18.1%. The source prices are weekly: the median gap between observations is seven days, and 99.6% of audited intervals are six to eight days apart.
Offset 0 is the weekly observation immediately before the ex-dividend-date observation. Offset 1 is the observation recorded on the ex-dividend date. Each step represents the next or previous stored weekly price observation, not a trading day or a guaranteed seven-day interval. Most observations are seven days apart, but occasional missing weeks make some intervals longer.
Price Change Calculation
Each series expresses the price at a weekly observation as a percentage change from offset 0. Positive values are above that baseline and negative values are below it.
Statistical Measures
The lines show mean price changes for the events contributing at each weekly offset. The shaded regions show ±1 standard error. Sample counts can vary near the edges of the 60-observation window when a stock lacks sufficient history.
3. Results
The reviewed sample covers 2009-03-26 to 2026-01-04 and contains 780 stock-date dividend events:
- 0–1%: 135 events
- 1–3%: 420 events
- >3%: 225 events
The group counts sum to the total because an event is identified by its stock and ex-dividend date, and each event belongs to one yield group.
Figure 1
Weekly price series around recorded ex-dividend dates
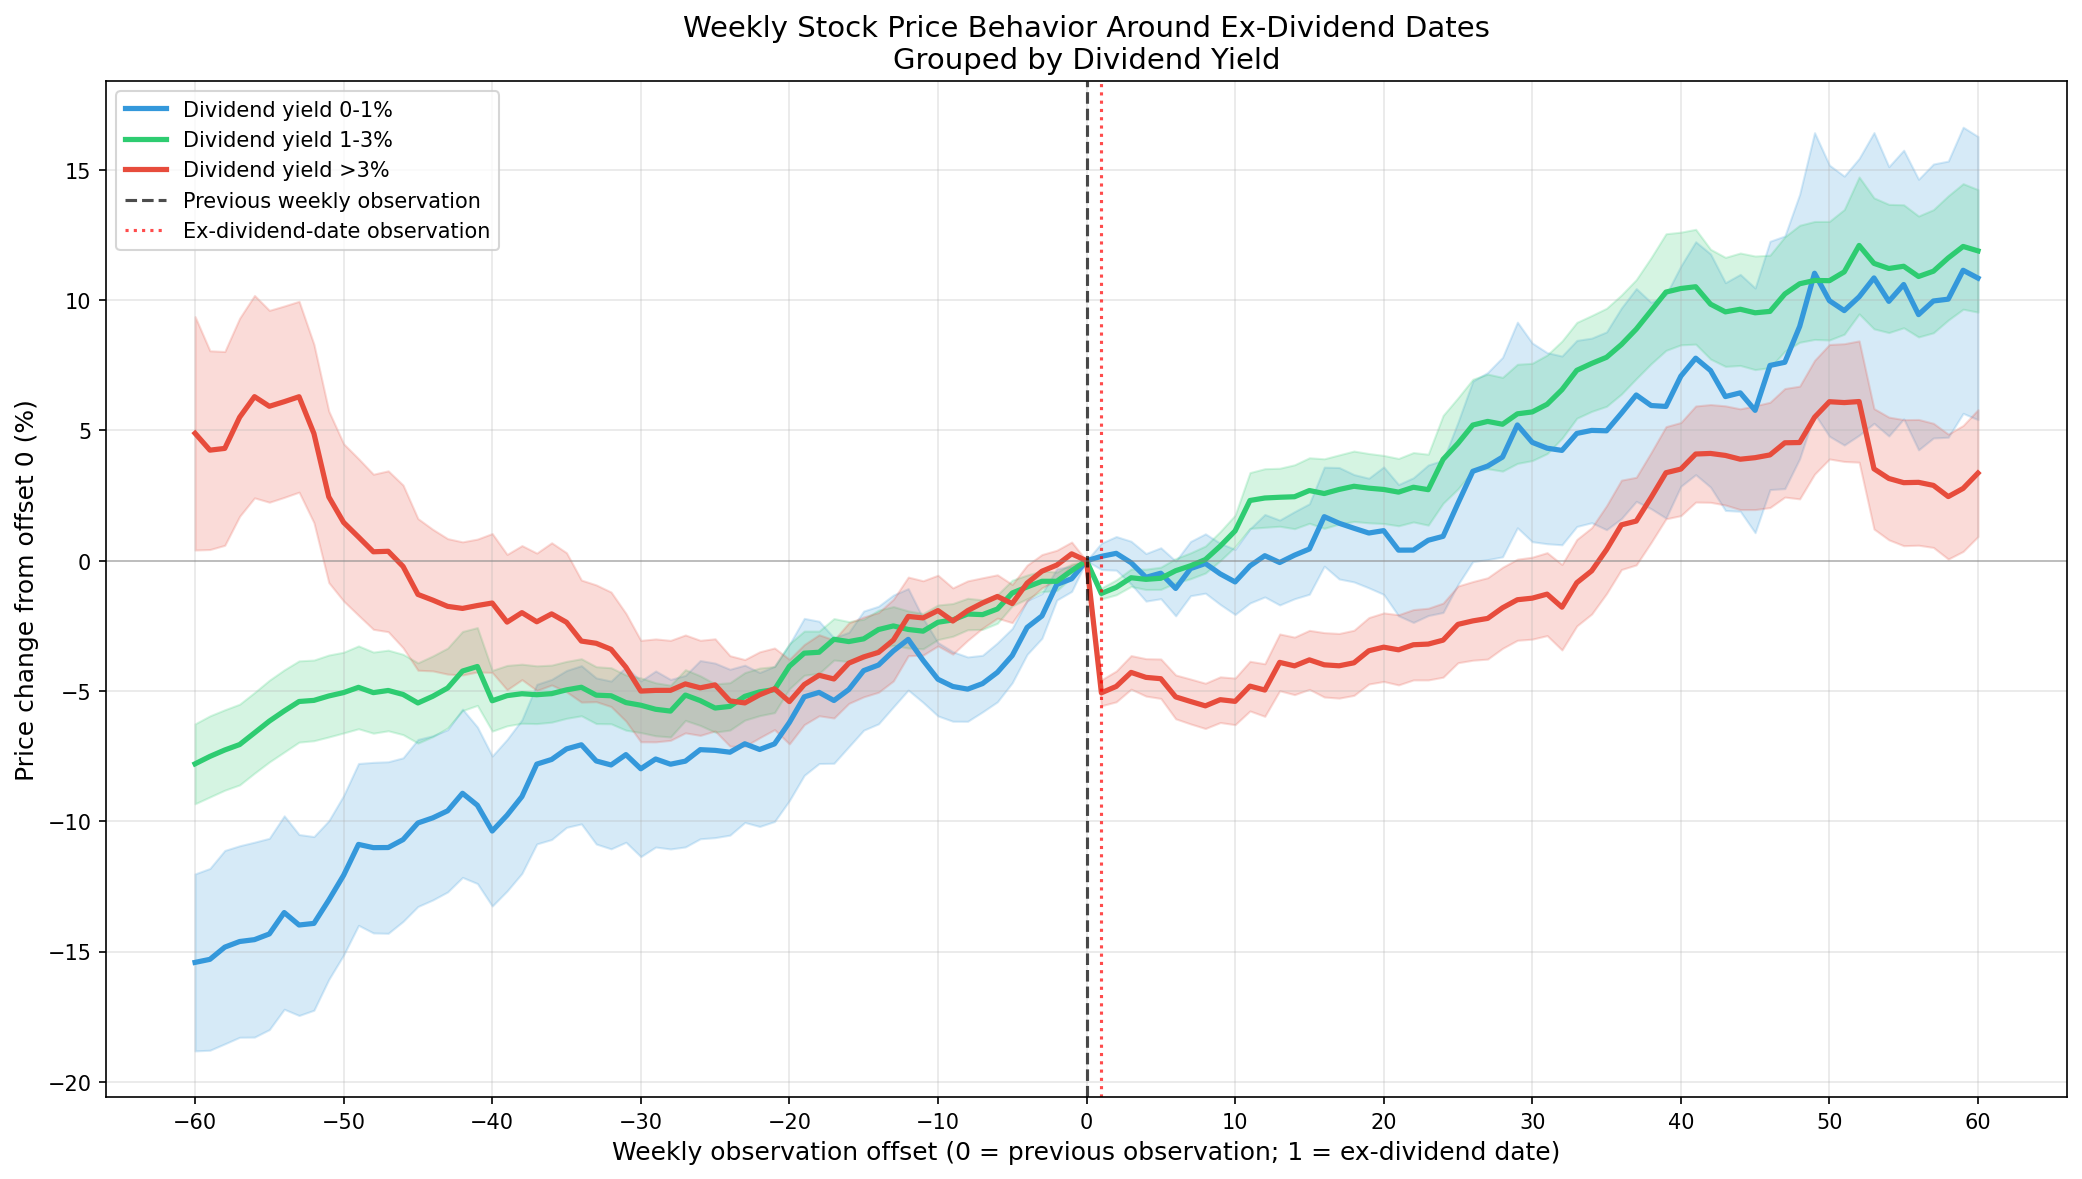
Mean weekly price changes relative to the observation immediately before the ex-dividend-date observation.
Note: The sample contains exact-date matches for 780 of 4,302 reviewed ordinary dividend records. The figure is descriptive of those selected events; it is not a causal estimate. Activate the image to inspect the full-resolution chart.
4. Discussion
The curves describe the selected sample on its actual weekly frequency. They can be compared as historical patterns, but the figure alone cannot determine why prices moved or whether a dividend-capture strategy would work.
Limitations
- Selection: Exact-date matching retains 780 of 4,302 reviewed ordinary dividend records, so the selected events may differ from excluded records.
- Weekly resolution: Adjacent offsets are weekly observations and cannot identify movements within each intervening week.
- Changing sample size: Events without a complete 60-observation history do not contribute at every offset.
- Uncontrolled effects: Broad market movement, selection effects, survivorship, tax treatment, and transaction costs are not controlled here.
5. Conclusion
This analysis describes weekly price observations for 780 stock-date dividend events, grouped by dividend yield. The corrected event counts reconcile, and the chart now labels its weekly cadence and event alignment directly. Its patterns apply to the selected historical sample and should not be read as a causal result or a practical trading recommendation.