Abstract
This post explores how stock prices move after publicly disclosed insider transactions on the Swedish market. It compares increased holdings (Buy) with decreased holdings (Sell), grouping the later price change into negative, neutral, and positive outcomes around a ±5% band.
Across 16,557 disclosure records with sufficient price history, increased holdings were followed by 39.4% positive and 38.7% negative outcomes. Decreased holdings were followed by 40.9% positive and 47.9% negative outcomes. It is an interesting directional pattern, not a prediction.
1. Introduction
Publicly disclosed insider transactions — where executives, board members, and other key personnel change their holdings in their own company — are often studied as a possible signal of future stock performance. People close to a company may know more about its prospects, but their transactions can also reflect many ordinary personal or financial reasons.
The Swedish Financial Supervisory Authority (Finansinspektionen) mandates that all insider transactions be reported and published publicly. This transparency creates a rich dataset for academic and quantitative study.
Prior work in this project found a broadly balanced 24-week outcome distribution. This post takes one extra step: separate increased holdings from decreased holdings and see whether the two patterns look different.
Research Questions
- What is the overall distribution of 24-week stock-price outcomes?
- Do insider buys and sells produce different outcome distributions?
- Do the observed Buy/Sell outcome distributions differ by reported position?
2. Data & Methodology
2.1 Data Sources
- Insider transactions: Finansinspektionen’s public register — reportable transactions by persons discharging managerial responsibilities (PDMRs) and their closely associated persons.
- Stock prices: Avanza weekly closing prices, used to compute forward returns.
- Company data: GLEIF identifier data supports company matching.
The records used here run through January 2026.
2.2 Transaction Classification
The project groups 27 observed transaction labels into Buy (Öka — increased holdings) or Sell (Minska — decreased holdings). These are convenient project-defined directions that include more than straightforward purchases and sales.
2.3 Outcome Binning
For each record, we match the first weekly Avanza price observation after the reported transaction date and compare its closing price with the close 24 weekly observations later. We use a five-percentage-point buffer around zero:
- Negative: at or below −5%
- Neutral: above −5% through +5%
- Positive: >+5%
This is simply a readable way to separate larger moves from a relatively flat middle band; it is not the only possible threshold.
2.4 Position Hierarchy
Finansinspektionen records the insider’s role, and a filing can contain more than one position (for example, a CEO who also sits on the board).
To assign each transaction a single, unambiguous role for filtering, we define a seniority hierarchy and resolve compound positions to the highest-ranked role:
- CEO
- Board Chair
- Deputy CEO
- CFO
- Board Member
- Board Deputy
- Other Senior Officer
- Other Admin Member
- Employee Representative
For example, a filing under both CEO and Board Member is resolved to CEO. This keeps each record in one position filter.
2.5 Experiments along the way
Before settling on the transparent comparison in this post, the project tried several more ambitious side paths:
- Realtime alerts: a small watcher checked Finansinspektionen’s publication page once a minute and was designed to send an email when the newest row changed. The archive preserves the prototype, but no reliable measure of its uptime or alert speed.
- LinkedIn enrichment: the idea was to link the buyers and sellers to LinkedIn accounts and add context such as education level and work experience. The account was banned during the experiment before I could collect usable data, so none of that information appears in this post.
- A U.S. SEC branch: another notebook collected the OpenInsider view of U.S. filings and experimented with purchases, sales, insider titles, and six-month returns. It contains model code, but no preserved evaluation result that is solid enough to report here.
- LSTM: a recurrent neural network looked at sequences of five earlier disclosure events and tried to classify whether the six-month return would exceed 50%. One saved run reached a test ROC AUC of 0.64: better than a coin flip, but not compelling enough to turn into a claim or trading rule.
- RandomForest: a separate regressor tried to predict the six-month return from aggregated transaction history. Its held-out R² was -0.014, meaning it performed slightly worse than simply predicting the test-set average.
These experiments were useful precisely because most did not become the final method. The results below use Swedish public disclosures and the deterministic 24-week comparison described above—not realtime alerts, profile data, U.S. filings, or model predictions.
3. Results
3.1 Sample Overview
The final dataset contains 16,557 public disclosure records with sufficient price history for this comparison, spanning 2023-01-01 to 2026-01-23.
3.2 Aggregate Distribution (±5%)
Figure 1 shows the overall outcome distribution. The negative and positive shares are close, so the aggregate view has no obvious one-sided pattern.
Figure 1
Aggregate 24-week outcome distribution
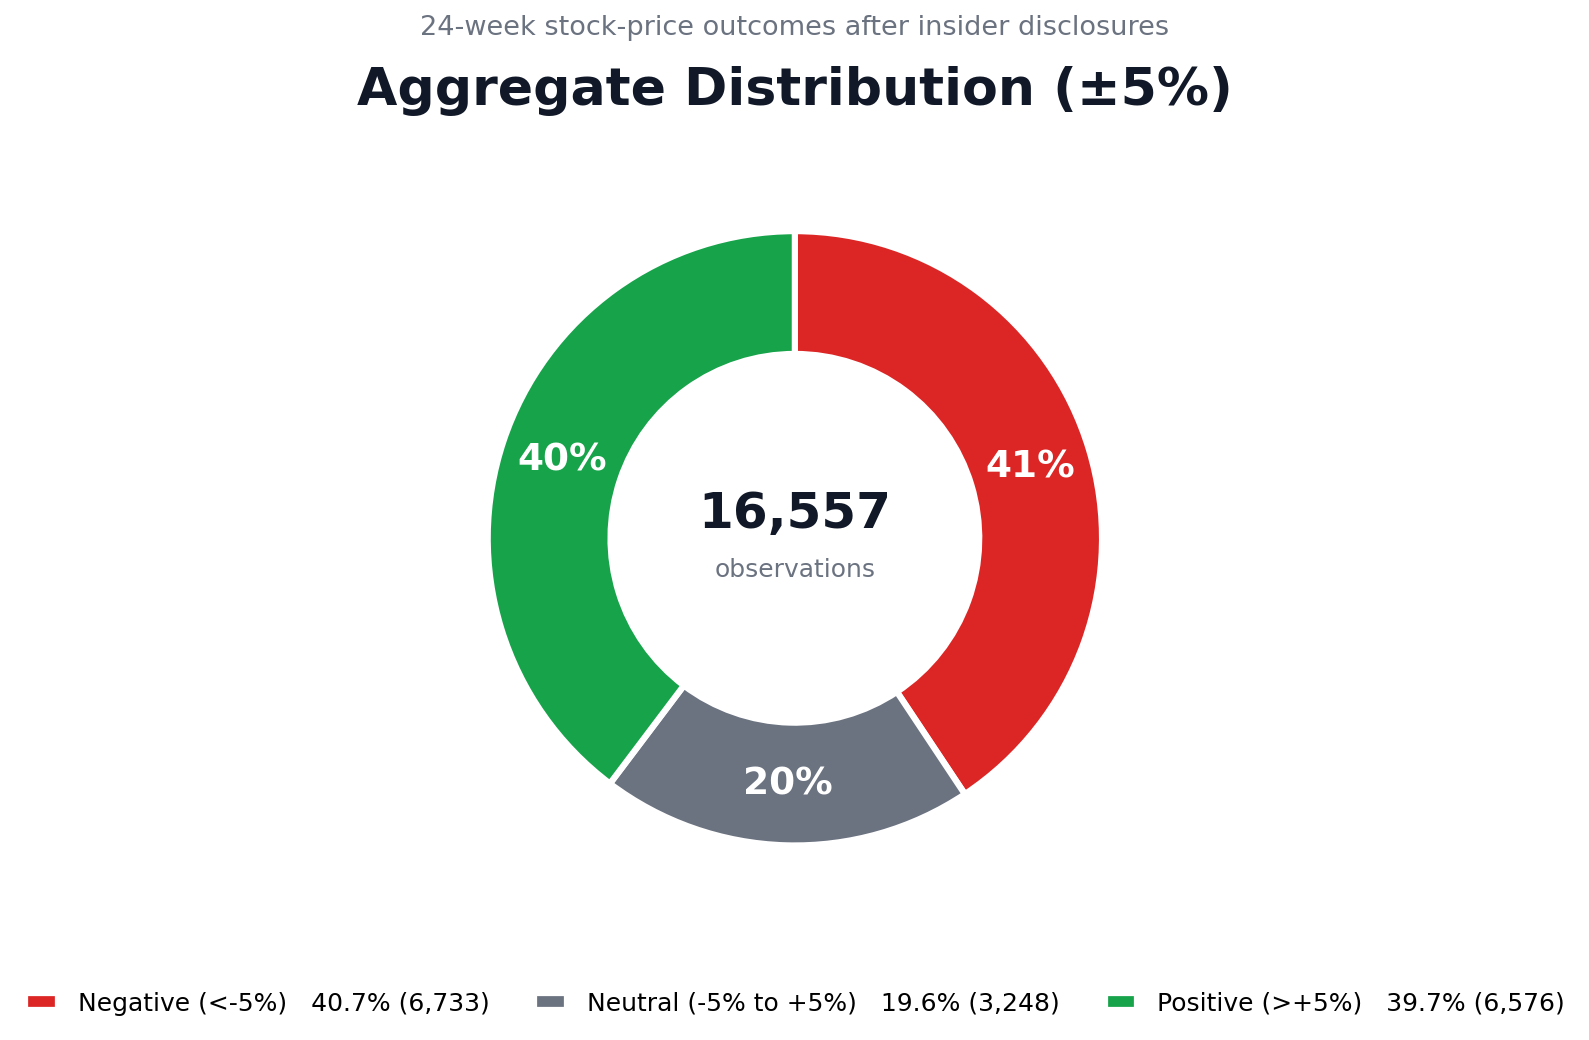
The negative and positive shares are close, so the aggregate view has no obvious one-sided pattern.
Note: Outcomes compare the first weekly Avanza close after the reported transaction date with the close 24 weekly observations later and use the ±5% threshold defined above.
3.3 Buy vs. Sell Breakdown
Figure 2 disaggregates the distribution by transaction direction at the ±5% threshold. Insider buys show 39.4% positive outcomes versus 38.7% negative, while insider sells show 40.9% positive versus 47.9% negative. Only 19.6% of transactions fall in the neutral band, meaning the remaining 80.4% fall outside the ±5% neutral band.
Use the filter below to explore all nine detailed positions or compare the four broader role categories. The displayed sample size changes with the filter.
Figure 2
Outcome distribution by transaction direction at the ±5% threshold
Buy and sell outcome percentages for all positions at the ±5% threshold.
Share within transaction direction (%)
Increased and decreased holdings have different negative, neutral, and positive outcome shares in this sample. Use the position filter to compare the displayed role groups.
Note: Outcomes use the ±5% threshold defined in the methodology. The displayed sample sizes update with the selected filter.
3.4 Position-Level Analysis
The table asks a simple follow-up: within each role, do Buy and Sell outcomes look different beyond the overall comparison?
Table 1
Buy and sell outcome patterns by reported position
| Position | Buy n | Buy Pos. | Buy Mean | Sell n | Sell Neg. | Sell Mean | p-value | Sig. |
|---|---|---|---|---|---|---|---|---|
| CEO | 2650 | 38.4% | +2.7% | 1156 | 65.9% | -19.3% | <0.001 | p < 0.05 |
| Board Chair | 2101 | 44.4% | +6.8% | 433 | 35.8% | +18.7% | 0.12 | n.s. |
| Deputy CEO | 249 | 32.9% | +0.5% | 72 | 58.3% | -2.6% | 0.44 | n.s. |
| CFO | 869 | 42.3% | +4.6% | 248 | 30.2% | +5.9% | <0.001 | p < 0.05 |
| Board Member | 3416 | 45.1% | +5.7% | 701 | 41.8% | +4.1% | <0.001 | p < 0.05 |
| Other Senior Officer | 975 | 37.9% | +4.0% | 327 | 45.9% | -1.8% | 0.72 | n.s. |
| Other Admin Member | 2514 | 28.1% | +1.9% | 591 | 36.7% | +3.6% | <0.001 | p < 0.05 |
| Employee Representative | 220 | 46.8% | +4.3% | 20 | 35.0% | +4.9% | 0.44 | n.s. |
Note: Buy Pos. is the positive-outcome share after increased holdings; Sell Neg. is the negative-outcome share after decreased holdings. The exploratory chi-square tests compare each role's Buy/Sell × Negative/Neutral/Positive distribution at ±5%. Positions with fewer than 5 observations in either direction are omitted. The p-values are uncorrected across roles; Sig. uses α=0.05 and n.s. means not significant.
The exploratory tests detect differences for CEO, CFO, Board Member, and Other Admin Member. For the other displayed roles, this analysis does not detect a clear difference between Buy and Sell outcomes.
4. Discussion
4.1 Interpretation
The interesting pattern is that the overall distribution and the increased-holdings distribution are balanced, while decreased holdings have a larger negative share. This post cannot establish why the two directions differ.
Sales can happen for diversification, liquidity, or tax reasons, which may add noise rather than explain the larger negative share after decreased holdings. Buying may be easier to interpret as confidence, but that remains a possible story rather than a causal finding.
4.2 Position-Level Patterns
The position filters show that the pattern is not identical across roles. Where the exploratory test is significant, this sample contains a detectable Buy/Sell distribution difference. Where it is not significant, the post simply did not detect a clear difference; smaller samples or smaller effects are both possible.
4.3 Limitations
- Publication Delay: Transactions become public only after they are reported, so an outside reader could not act from the transaction-date baseline used here. This analysis does not model that delay.
- Confounding Factors: Stock movements are driven by many variables beyond insider activity — earnings, macro events, and sector rotation. Returns are not adjusted against a market or sector benchmark.
- Survivorship Bias: Companies that delist during the 24-week window may be underrepresented, biasing results.
- Transaction Costs: Brokerage fees, bid-ask spreads, and market impact are not accounted for.
- Sample Composition: The Buy/Sell ratio in the dataset may not be 50/50, which affects the relative weight of each group in the aggregate view.
5. Conclusion
This exploration goes one step beyond a single aggregate distribution by separating transaction directions and reported roles. Three patterns stand out:
- The aggregate 24-week outcome distribution at ±5% is relatively balanced, with no obvious one-sided pattern.
- Insider buys are nearly balanced between positive and negative outcomes, while insider sells have a larger negative share.
- The observed Buy/Sell differences vary by reported role.
Future work should combine this directional pattern with features such as transaction size, sector effects, timing, and a market or sector benchmark. Those extensions would test whether the associations here remain after broader market conditions are taken into account.