I have been collecting the monthly values in Steam’s DirectX 12 GPU table to see how the mix changes. Five months in, NVIDIA is gaining recorded share and its new GTX cards are moving faster than the rest.
First I grouped the named rows by manufacturer. NVIDIA rises from 64.28% in November 2016 to 66.03% in March 2017, a gain of 1.75 percentage points. AMD slips from 15.40% to 15.13%, while Intel is almost unchanged at 6.16%.
Then I compared the new desktop gaming families in the table. NVIDIA’s GTX 10-series rows rise from 5.38% to 11.43%, while AMD’s RX 400-series rows rise from 0.50% to 1.82%.
NVIDIA is gaining with its new GTX cards
Figure 1
Manufacturer totals and new desktop GPU families
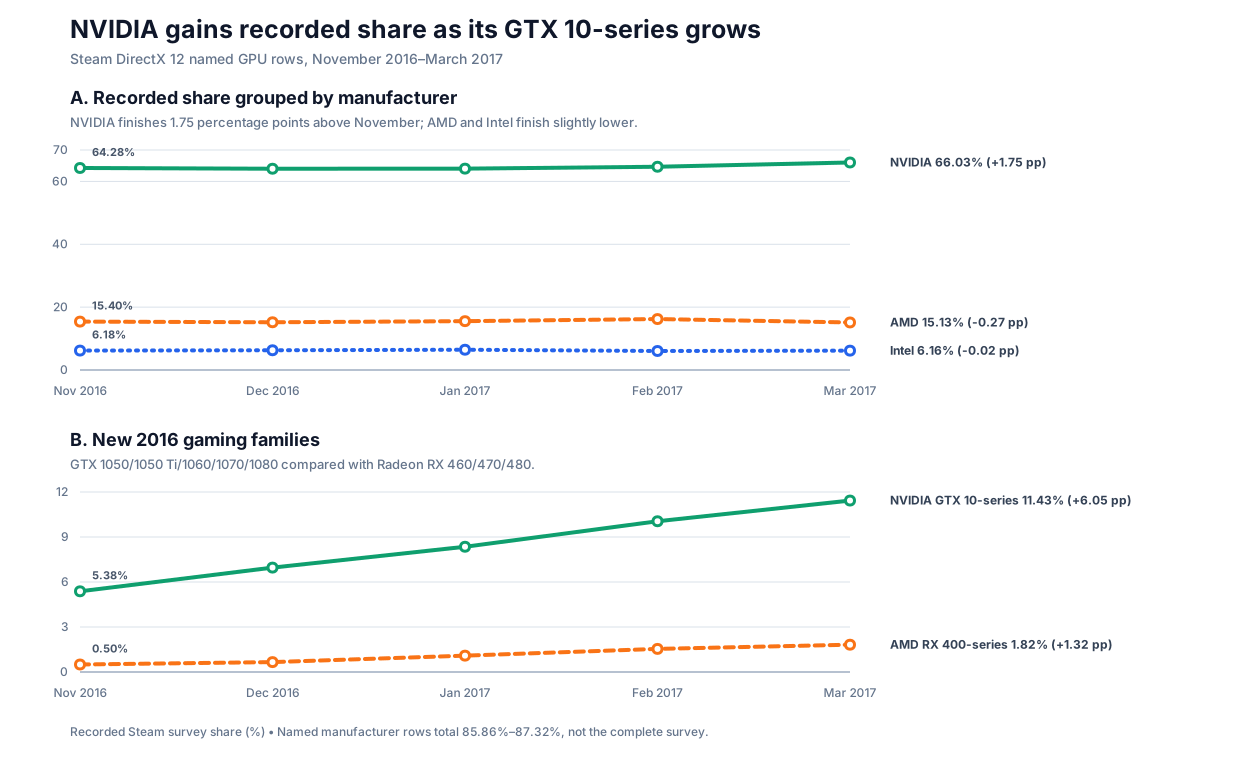
NVIDIA's named rows gain 1.75 percentage points, while the selected GTX 10-series rows more than double.
Note: These are sums of named rows in the collected DirectX 12 table, whose monthly totals range from 85.51% to 87.32%. They are not complete manufacturer market share or sales figures. The family comparison uses the GTX 1050, 1050 Ti, 1060, 1070, and 1080, and the Radeon RX 460, 470, and 480.
The new GTX 10-series adds 6.05 percentage points across these five months. Older NVIDIA rows fall by 4.30 points, but the new cards more than offset that decline and lift NVIDIA’s total.
The high-end GTX 1070 and GTX 1080 add 1.55 points together. The largest individual contribution, however, comes from the GTX 1060 at 2.39 points. This looks like strength across NVIDIA’s new generation, not only at the high end.
Five months of GTX 1060 growth
The GTX 1060 has recorded a higher share in every new monthly column.
Table 1
GTX 1060 recorded share from November 2016 to March 2017
| Month | Recorded share | Monthly change |
|---|---|---|
| November 2016 | 2.06% | — |
| December 2016 | 2.79% | +0.73 pp |
| January 2017 | 3.37% | +0.58 pp |
| February 2017 | 4.08% | +0.71 pp |
| March 2017 | 4.45% | +0.37 pp |
The recorded share rises in all four month-to-month comparisons and more than doubles across the full period.
Note: Change is measured in percentage points.
The increase is steady rather than coming from one exceptional month. The largest step so far is 0.73 percentage points between November and December; the latest step is smaller, but it is still positive.
Closing the gap
The GTX 1060 has not taken the lead. In March, the GTX 970 is still the largest named GPU in these rows at 5.89%. The GTX 750 Ti and GTX 960 are tied at 5.13%, with the GTX 1060 next at 4.45%.
Table 2
The four largest named GPU rows in March 2017
| GPU | November 2016 | March 2017 | Change |
|---|---|---|---|
| NVIDIA GeForce GTX 970 | 6.90% | 5.89% | −1.01 pp |
| NVIDIA GeForce GTX 750 Ti | 4.70% | 5.13% | +0.43 pp |
| NVIDIA GeForce GTX 960 | 5.11% | 5.13% | +0.02 pp |
| NVIDIA GeForce GTX 1060 | 2.06% | 4.45% | +2.39 pp |
The GTX 1060 is still fourth, but it has the largest increase of any named GPU with a positive value at both endpoints.
Note: A dash in the collected table can mean that a model was unlisted, so the endpoint comparison uses positive values only.
The gap between the GTX 1060 and GTX 970 has narrowed from 4.84 percentage points in November to 1.44 in March. The GTX 1060’s 2.39-point increase is also more than twice the 1.11-point increase recorded by the GTX 1070, the next largest gain in this comparison.
What I am watching next
The survey does not explain why the mix is changing. New PC builds, upgrades, prices, and game requirements could all matter. It measures reported usage, not unit sales. It only shows that more surveyed systems are reporting NVIDIA’s new cards, with the GTX 1060 recording a larger share each month.
It is not the leading named GPU yet, but it is closing the gap quickly. If the direction continues, the GTX 1060 could move past the older leaders in the coming months. I will also be watching whether the GTX 10-series keeps lifting NVIDIA’s total when the next survey column arrives.